OQLIS | Release Notes
OQLIS Release Notes
Every day we build new features to empower our customers

new feature
Dashboard Imports
Save time and resources by duplicating an existing dashboards.
Duplicate frequently used features and retain corporate identity across multiple dashboards
See how the dashboard import feature works

new feature
Data Source Control
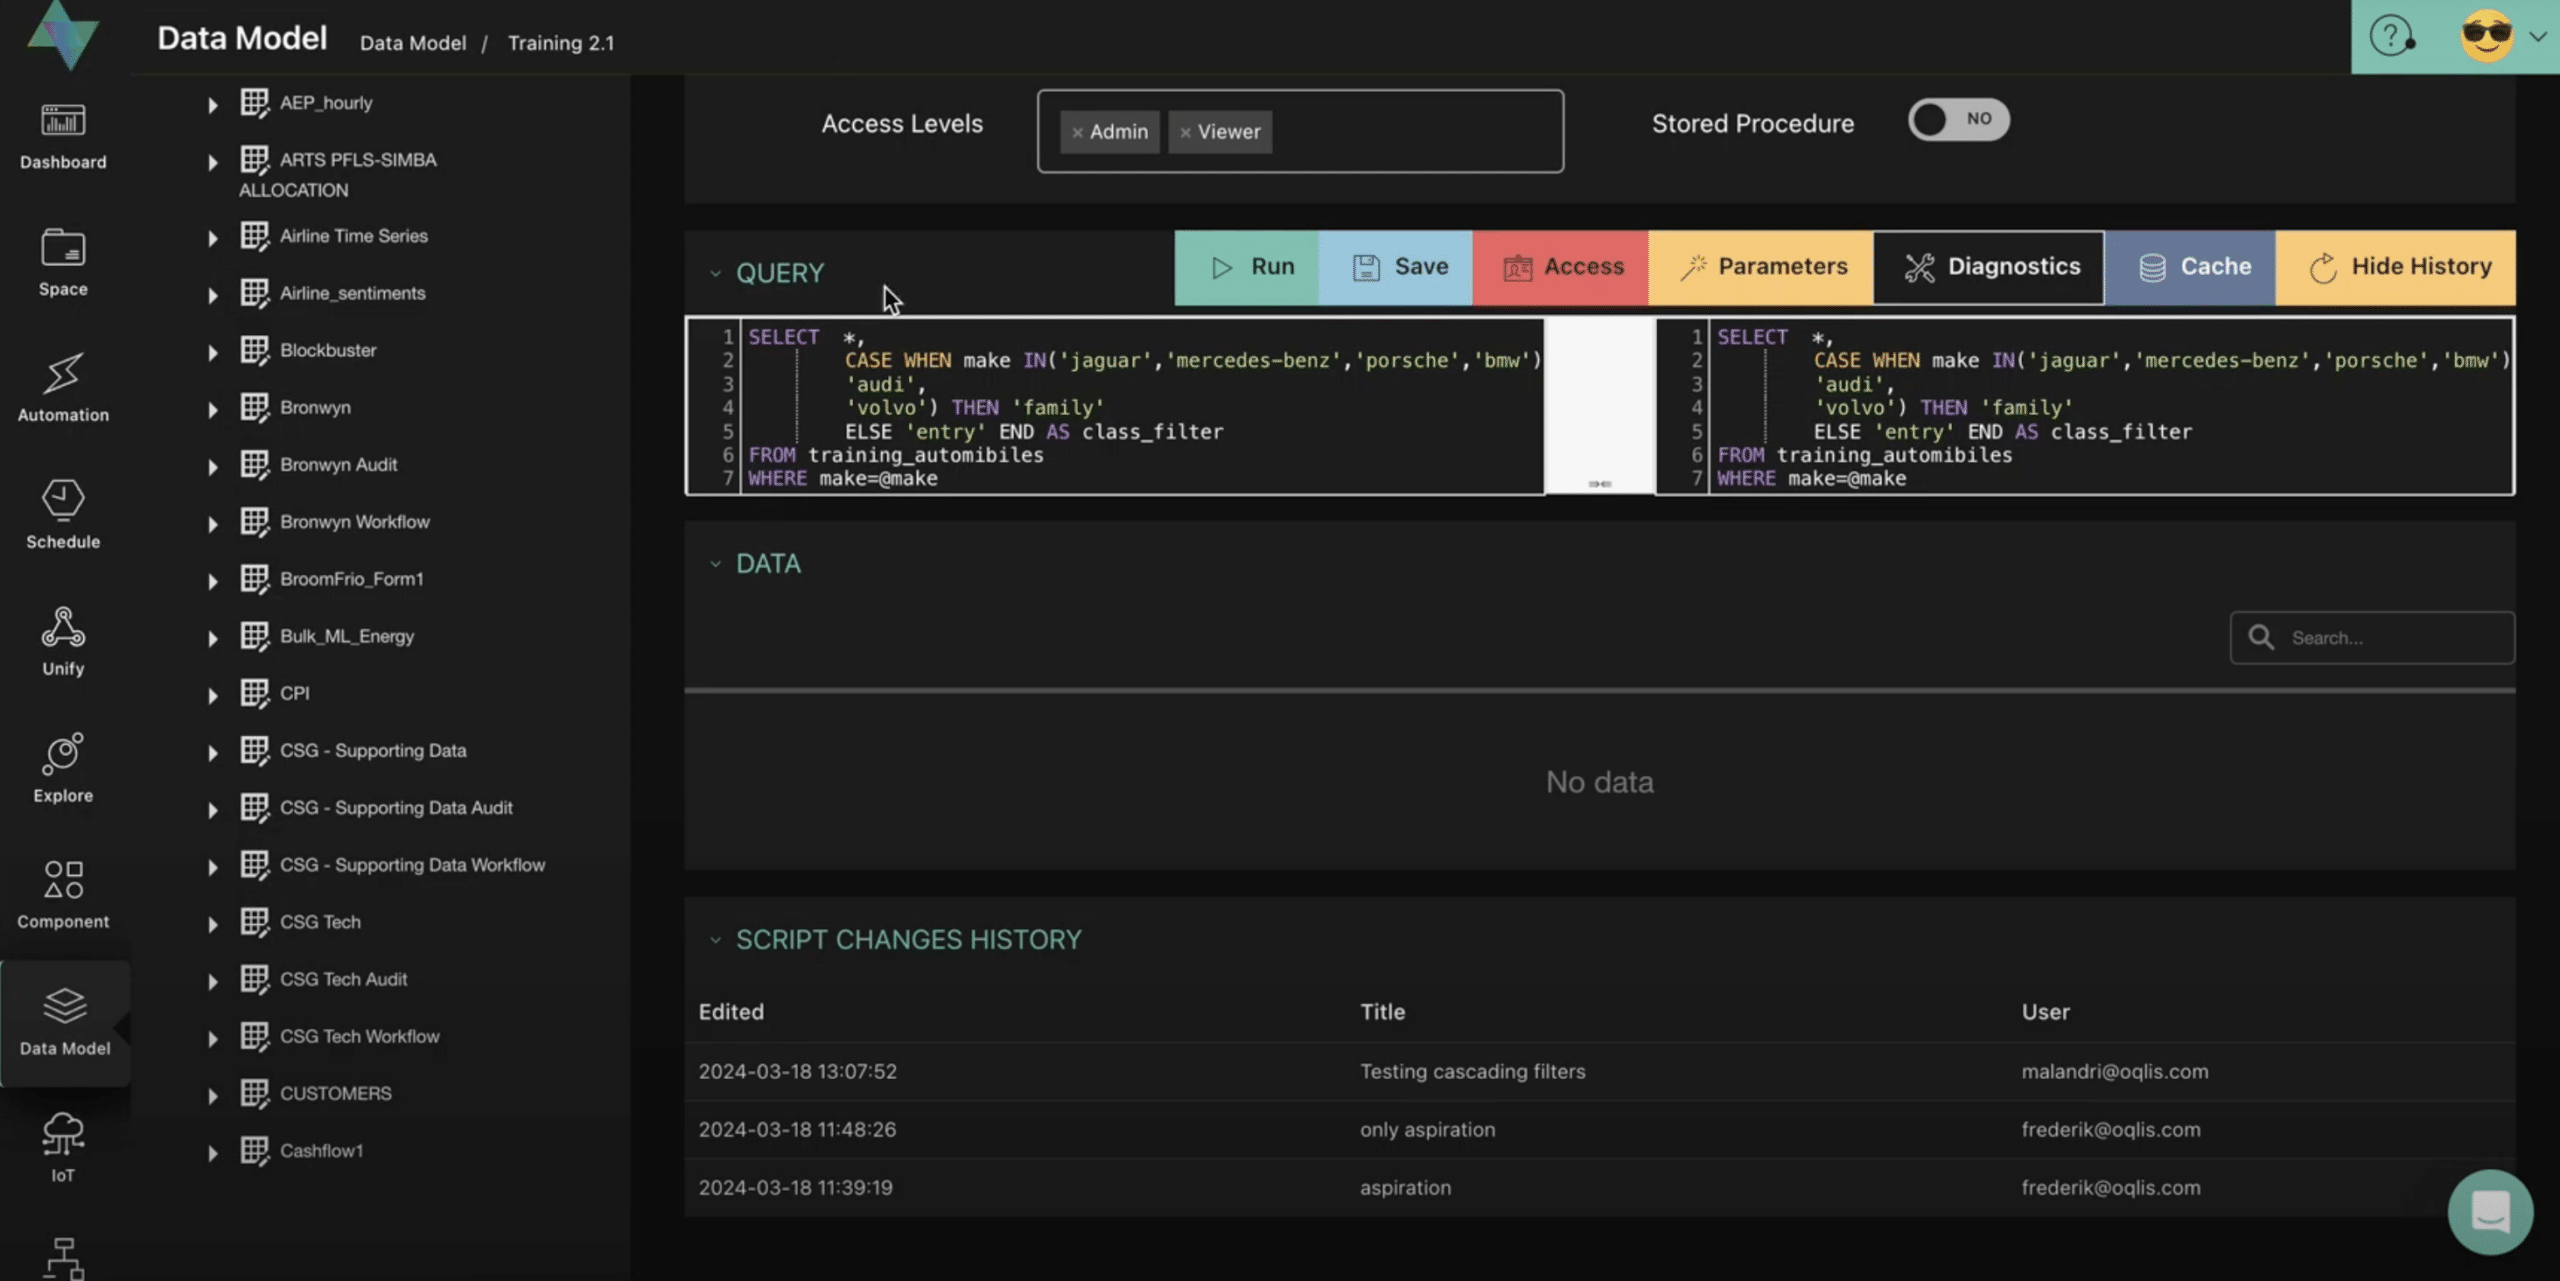
Keep track of modifications made in Data Models.
Quickly troubleshoot issues by identifying who made the changes and what the changes were.
Watch how this new feature works
new feature
New Home Page
Improves user experience and provides shortcut to recently accessed dashboards, explores and user activity
Widgets and analytical KPI’s give quick glance of number of dashboards, explores and workspaces
Watch the breakdown of all the new home page features

NEw FEATURE
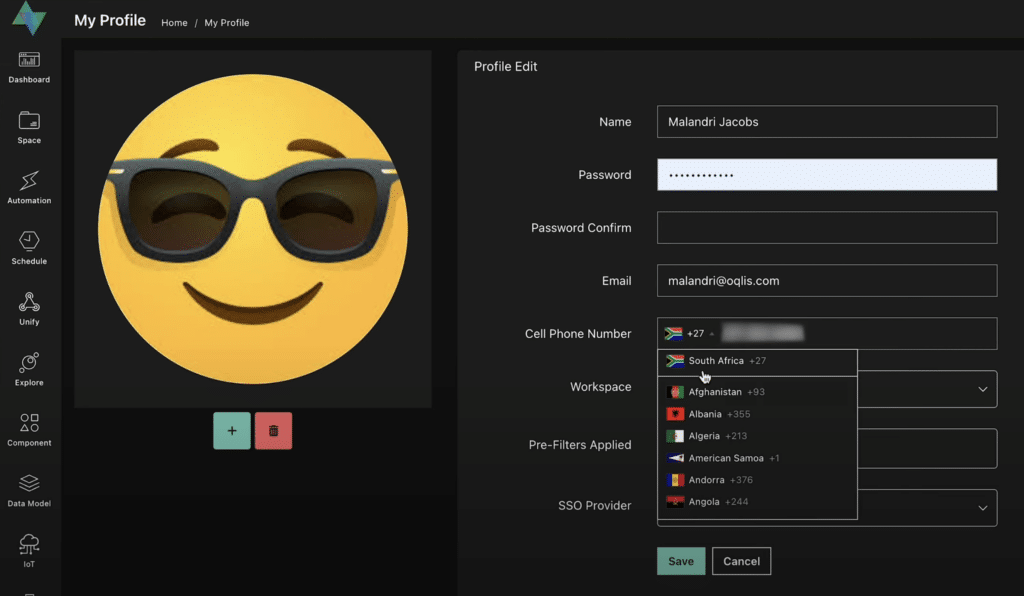
Add cellphone number to user profile
Improves user’s experience when setting up Automations
Caters for various country codes
Use SMS, Whatsapp or Automated Voice call functionality in Automations
Watch the step-by-step how-to video to set up user cellphone numbers and link to Automations
NEw FEATURE
Tabs and Cycling Tabs
Allow a user to switch between different content within one window. Essentially, the tabs create partitions for ease of use.
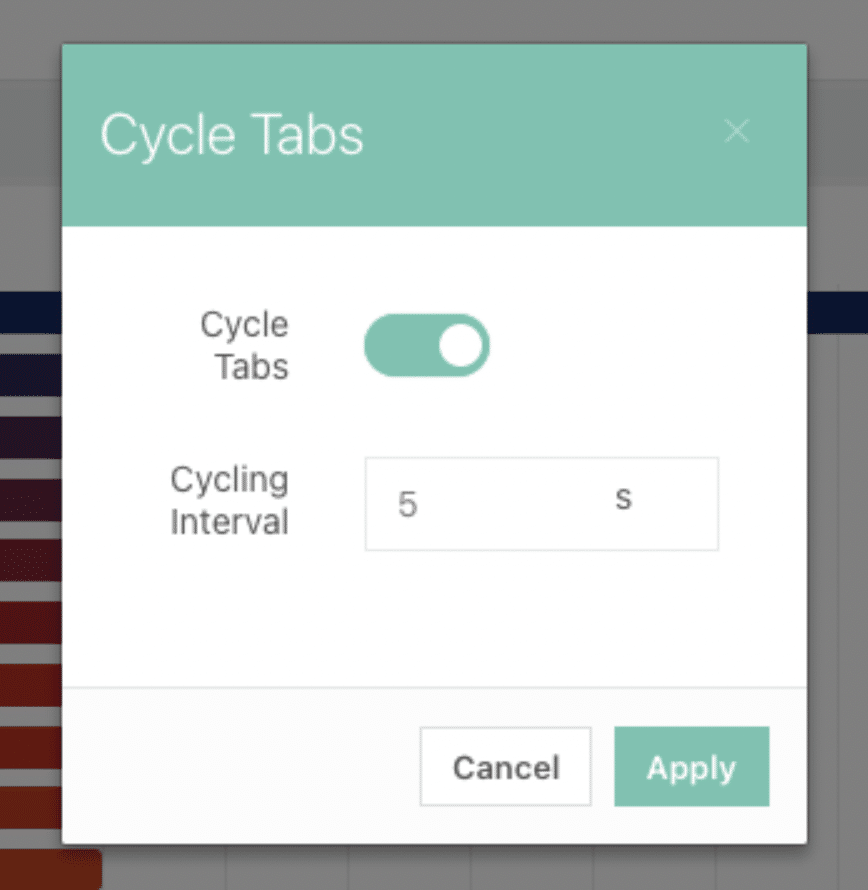
Cycling tabs is a cycled display of the content within the tabs. This feature is ideal to display on wall-mounted screens and monitors within a production line, or in an office environment.
Compacted information in one place, and able to select the interval (seconds) in which tabs must cycle.
This feature is ideal for wall-mounted screens/presentations for a quick glance at live environments.
new feature
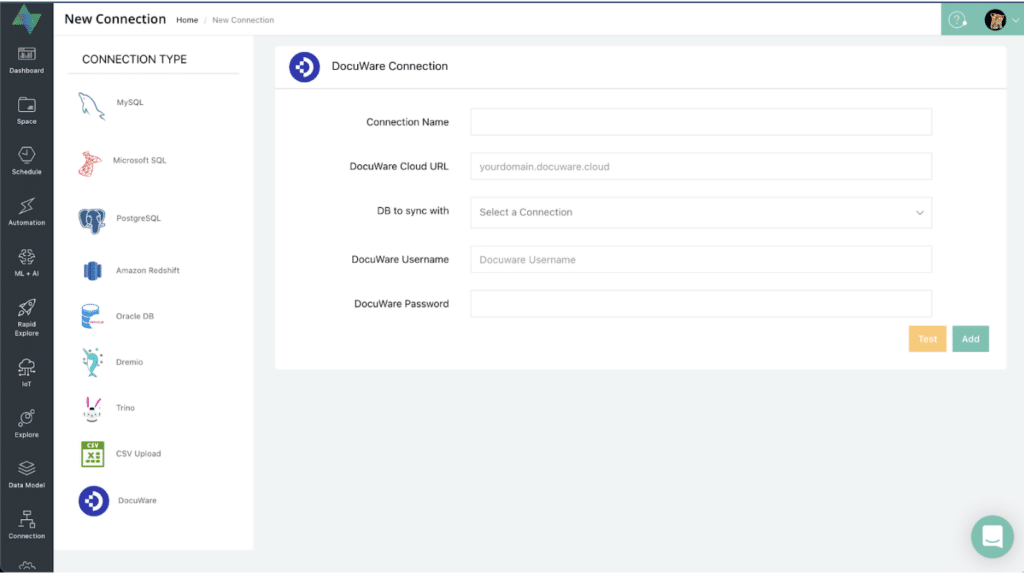
Sign up Custom DocuWare Reporting Instance
Unlock previously unseen metrics such as bottlenecks in your company's document pipeline and how to streamline quotes from initial draft to paid
Easy self-help set-up
Watch the step-by-step how-to video to set up your reporting instance
NEw FEATURE
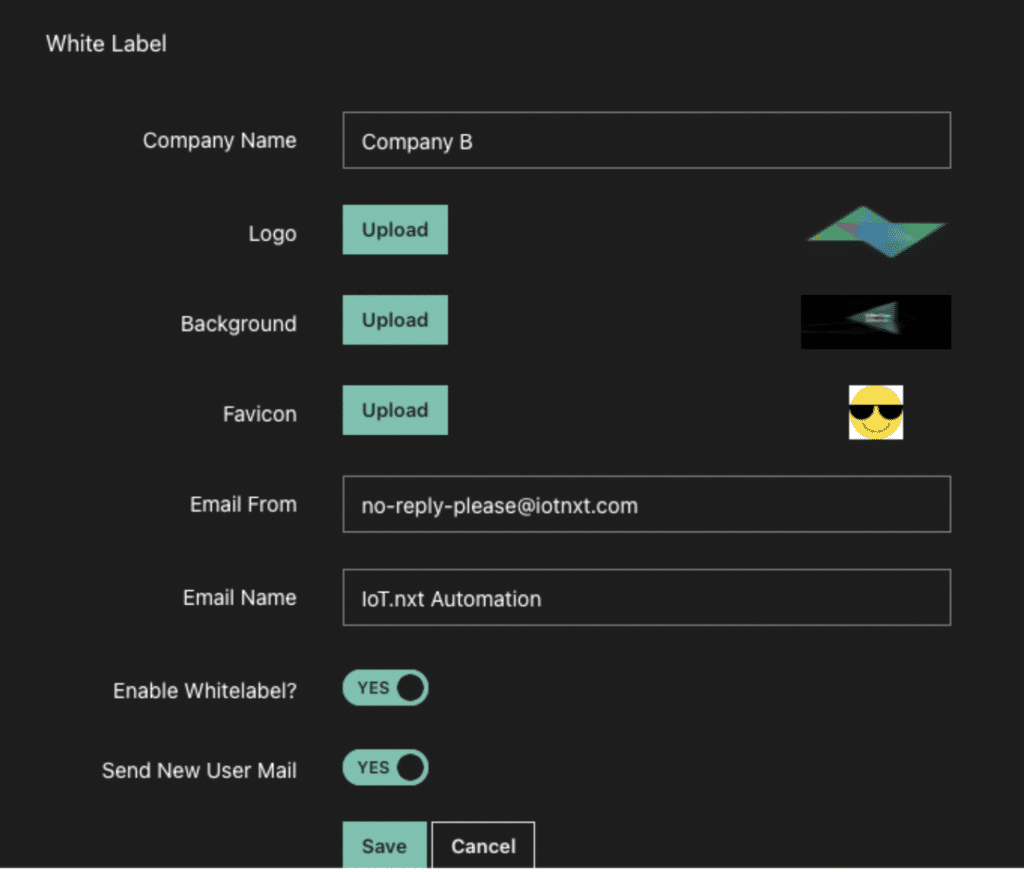
Favicon
Add to your business brand and corporate identity
Find your browser easily
Help users to quickly identify the dashboard
new feature
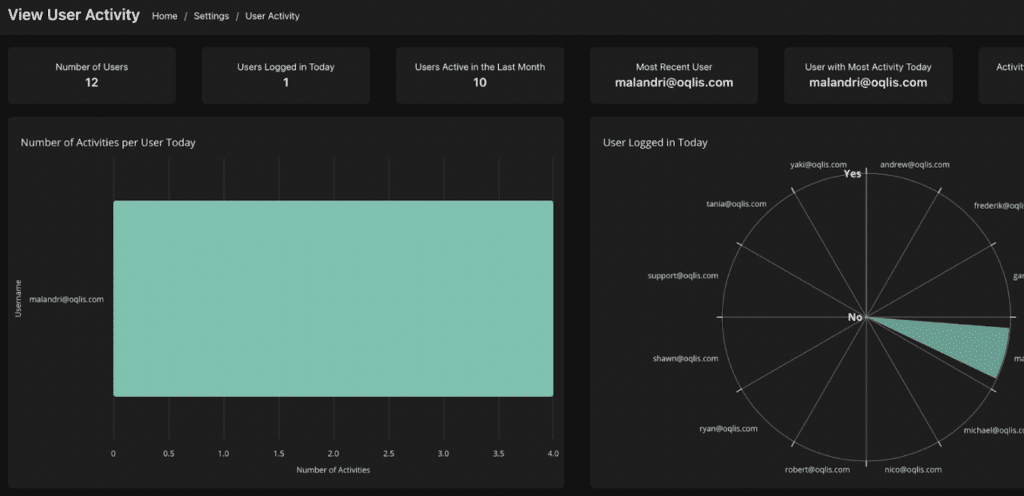
User Activity Dashboard
Monitoring user activity, helps companies monitor individual and overall productivity
Utilise resources and time optimally
Display vital productivity data in easy-to-understand graphs and sections
NEw FEATURE
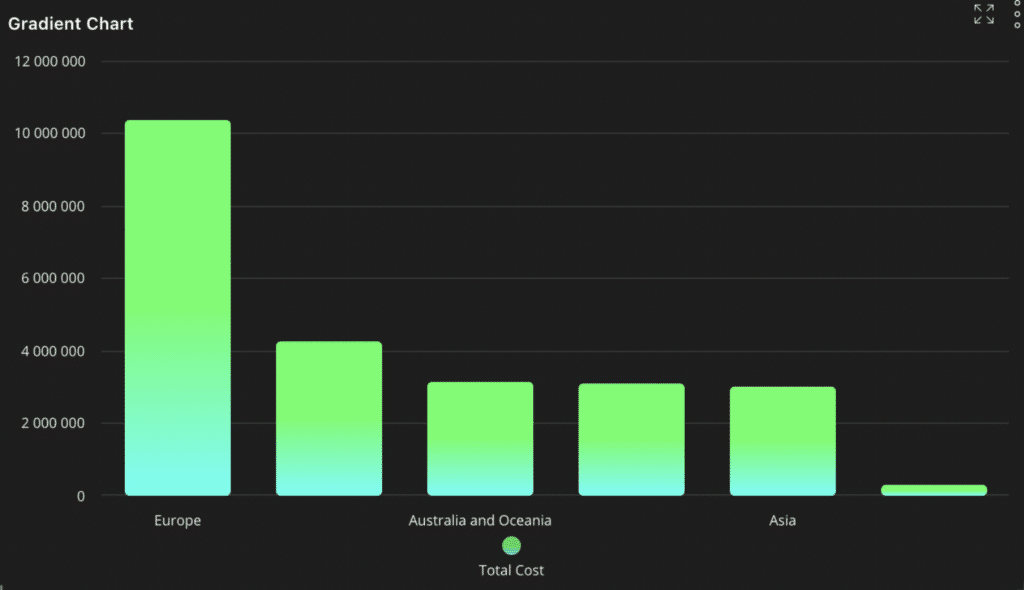
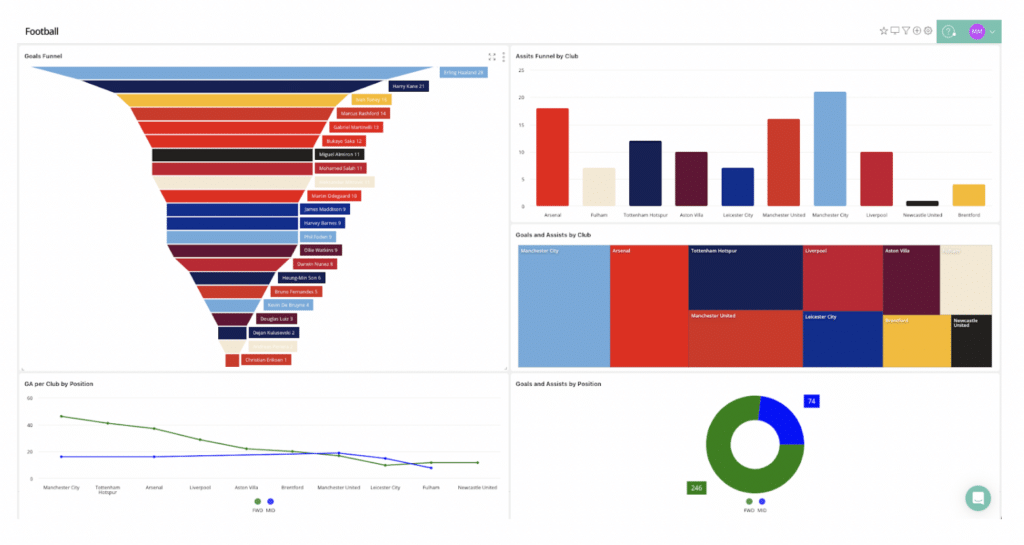
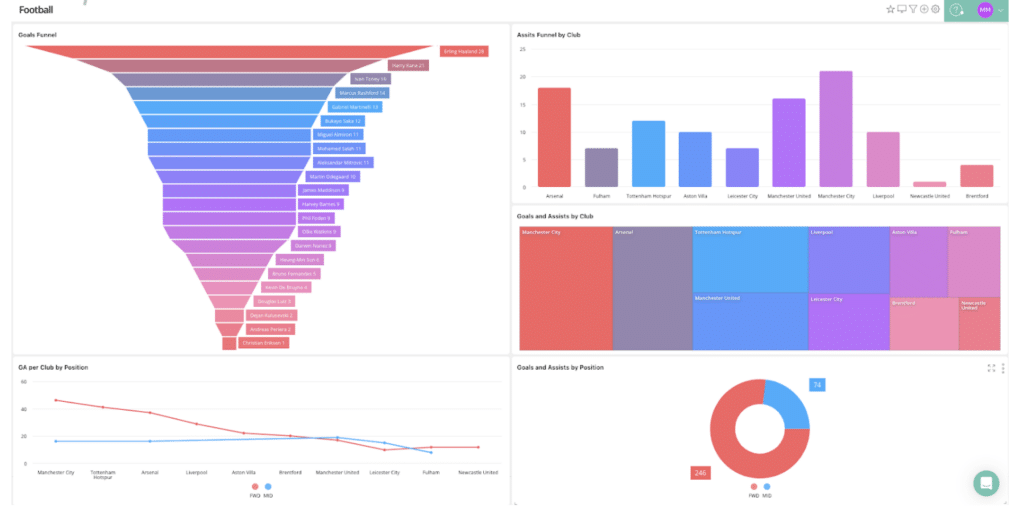
Gradient Charts
Improve visual representation
Create aesthetically pleasing and more creative charts
Gives the user more options to create visually appealing content
new feature
Custom Theme Configuration
Allows users to add custom theme or color to a particular series
Apply customizations across multiple dashboards and explores easily
Choose specific colors for arguments, apply theme to explores for display
Simplifies customisation for funnel, tree map and other graphic elements (no code)
Reduces chance of mistakes in customisation across multiple explores
NEw FEATURE
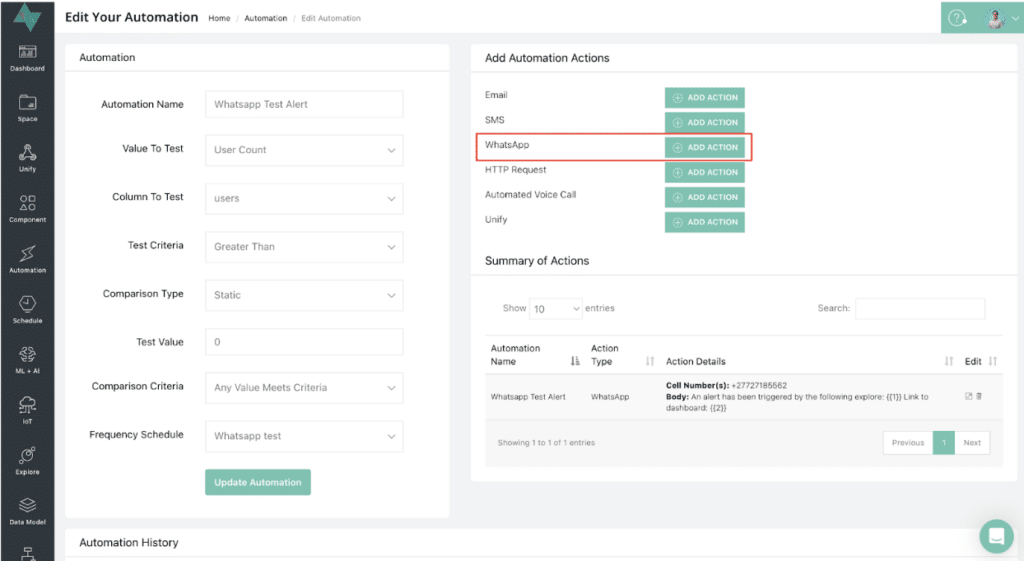
WhatsApp Alerts with Automations
Send WhatsApp alerts to clients based on pre-defined criteria
WhatsApp message template can be customised
Allows triggering of automation actions on a user-specified schedule
Automates specific actions and sends mobile notifications based on specific rules set up against own data
new feature
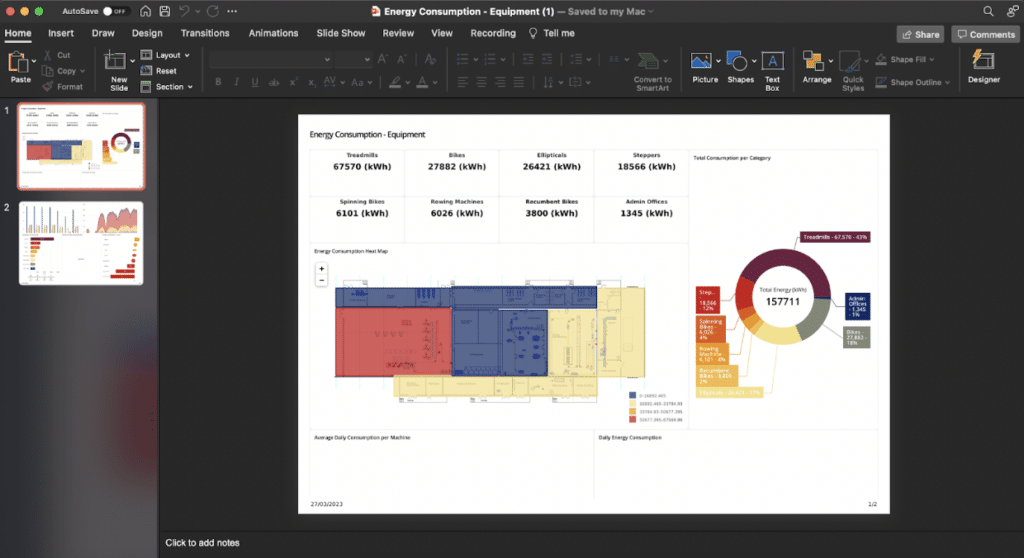
Export Dashboard to PowerPoint
Makes sharing and presenting dashboards easier for users
No need to download PDFs or take screenshots and convert to PowerPoint
Users can share dashboard contents via email to customers without access to their instance
Dashboard can be presented offline using export to PowerPoint feature
NEw FEATURE
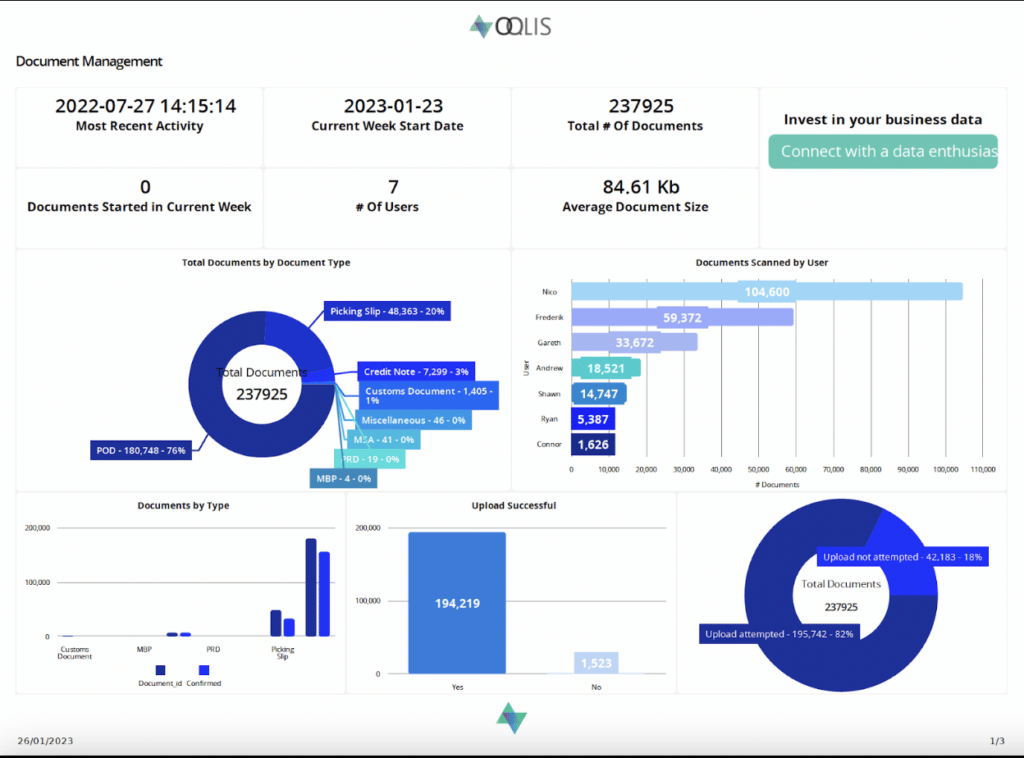
Branded PDF Reports
Add a personal touch to your OQLIS dashboard reports.
Brand the dashboard PDF generated through OQLIS with your own custom header and footer.
Your PDF dashboard reports will be automatically branded for sharing.
new feature
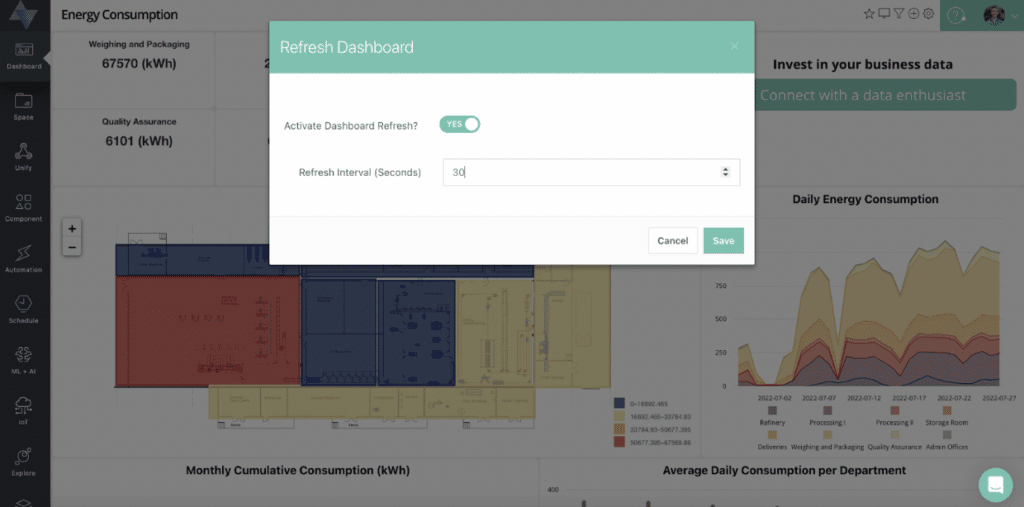
Dashboard Auto Refresh
Display dashboards on screen for long periods of time, while it automatically updates the latest insights without any manual intervention.
New data coming into the database will reflect automatically on the dashboard, altering charts in a live environment.
Choose your preferred refresh interval timing from various options.
NEw FEATURE
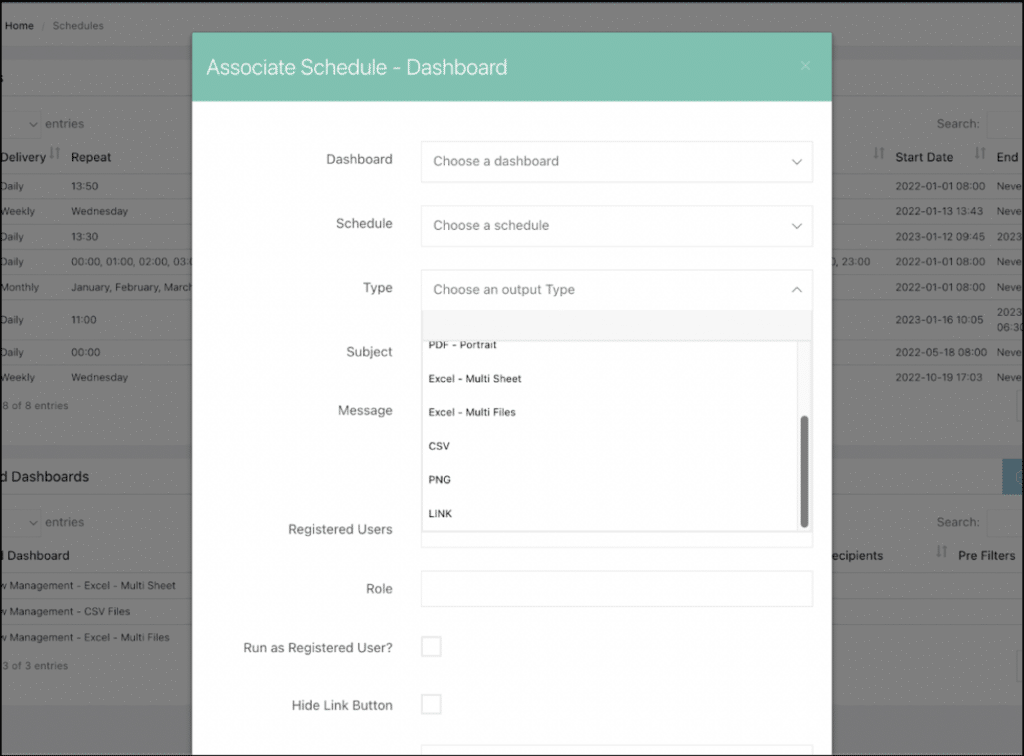
Export to Excel & CSV
Export dashboard data as raw data files as a single Excel file with multiple tabs, multiple Excel files with one sheet, or multiple CSV files.
Easily use OQLIS software in symbiosis with Microsoft Office suite
COMPONENTS MODULE
Data Grid Writeback
Update data directly from a dashboard view. Add, edit or delete records from your database, on your dashboard.
Alter your business data without asking someone to change it from the backend.
Provide input and get real-time calculations and output from your dashboard.
Validate and fix any information that might be incorrectly captured.
NEw FEATURE
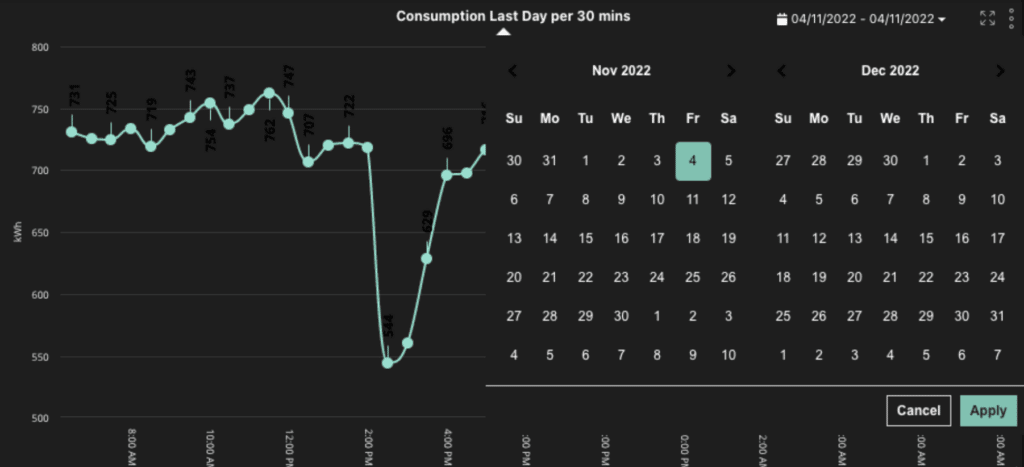
Date-picker
An extension of the existing filter function
Bypass the filters pane and set filtering dates straight from the charts
Pick dates from a calendar or filter through predefined time periods (for example yesterday or the last 7 days)

New feature
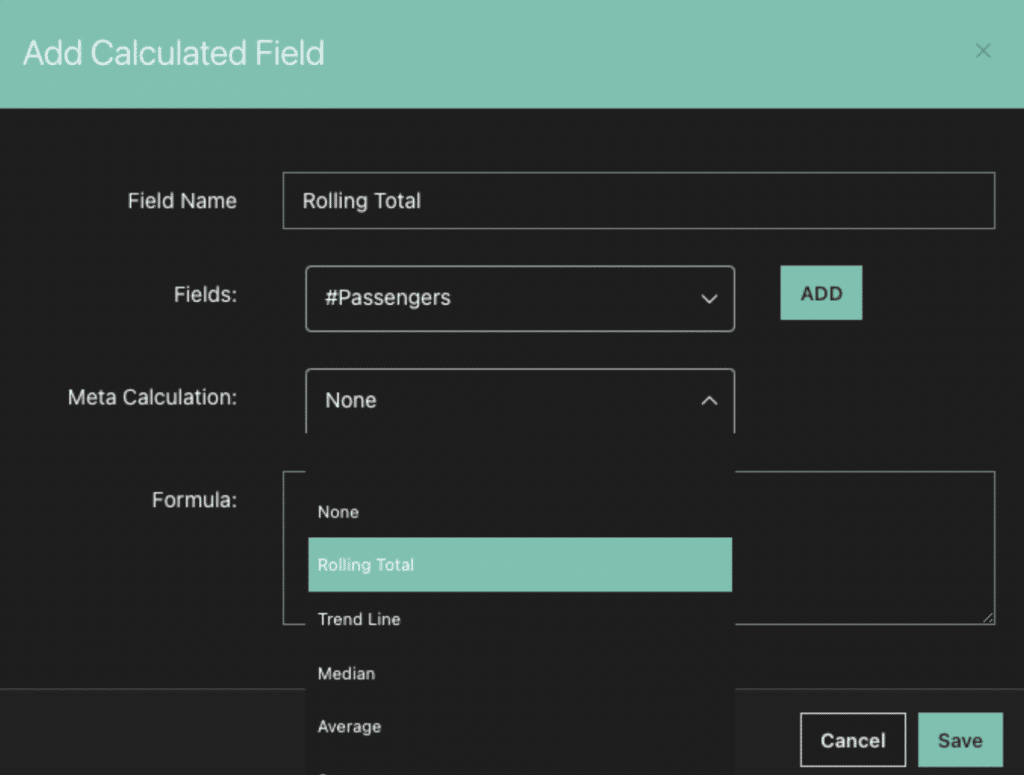
Meta Calculations
Complex calculations can now be done with the click of a button, no SQL queries
Visualise complex calculations which provides deeper insights to intricate data
NEw buttons
Drill-down Buttons
An add-on to current drill-down functionality, making it easier to switch between different drill-down levels.
Users now have more choices in creating explores
Access and filter different drill down levels by clicking on the buttons now visible on the chart
NEw Module: Iot
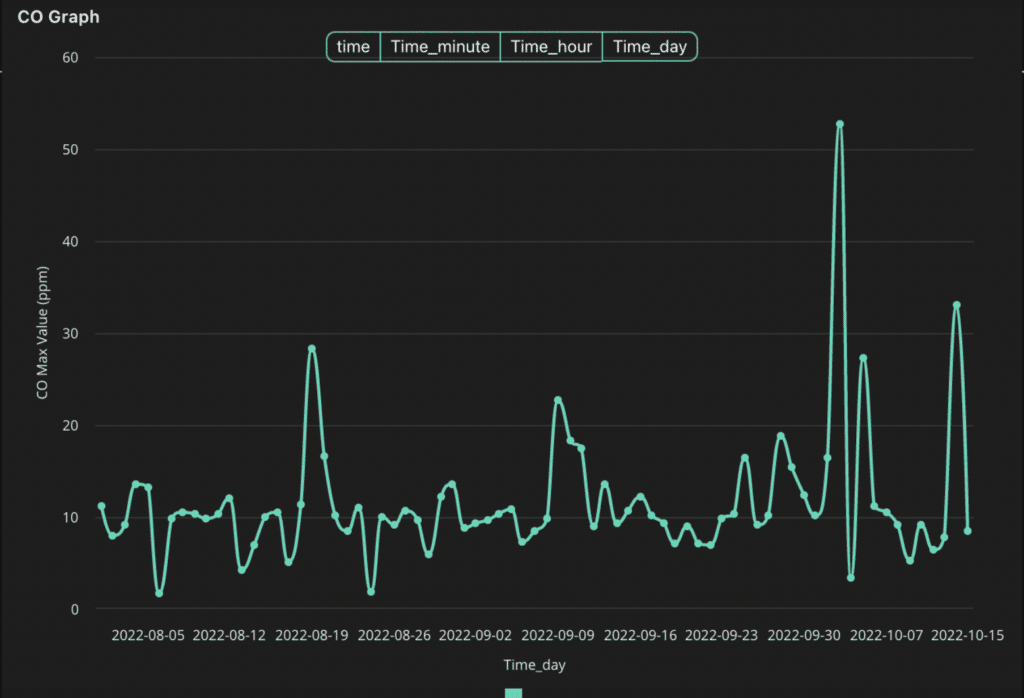
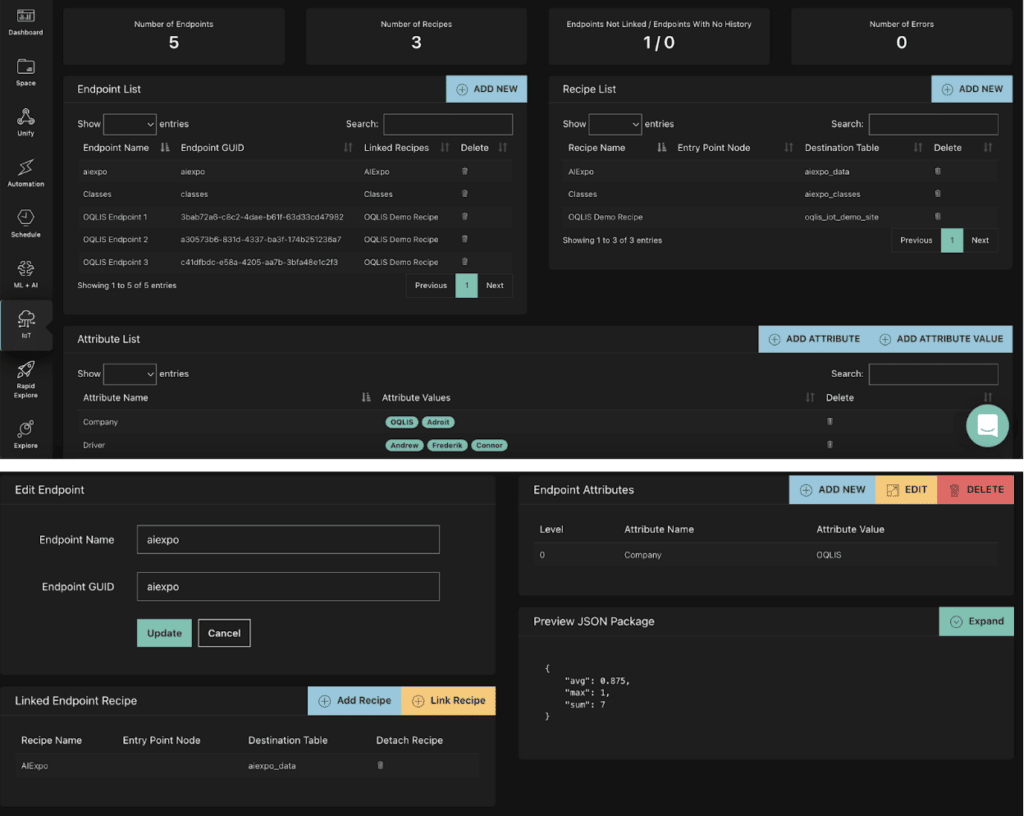
Enable IoT through OQLIS
An ingestion platform of IoT data sent from connected devices, straight into OQLIS without the need for intermediary steps
No need to make connections to outside databases. Easily set up tables and data models
No middle man. No additional setup or database costs


New feature
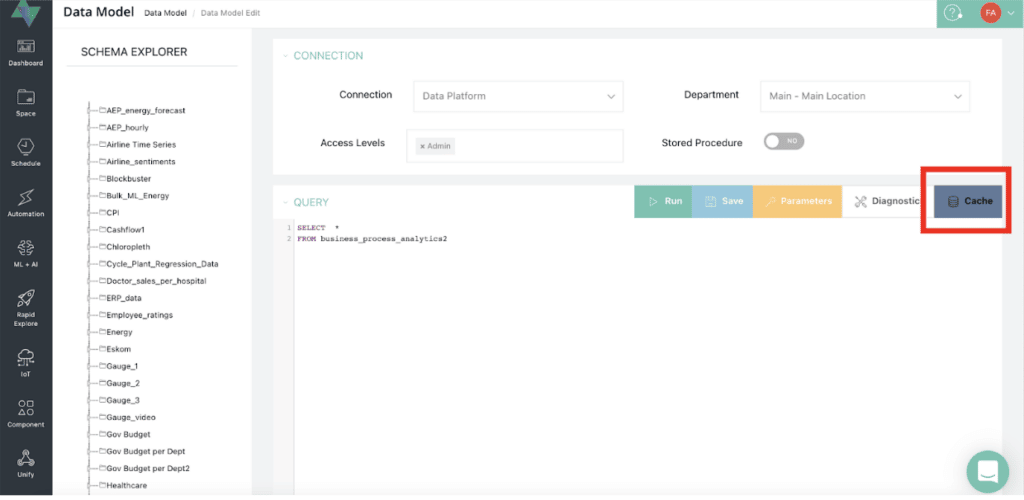
Data Model Cache
Loading speed increased on explores on the OQLIS dashboard
Move data between different tables or databases easily by using cache function
Customers are less reliant on the underlying speed of their resources
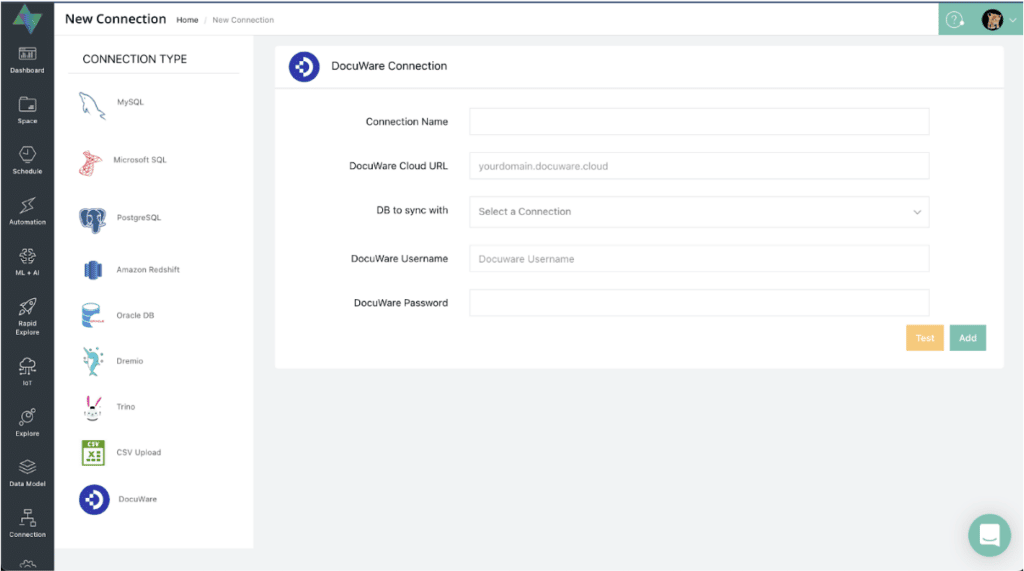
new connection
DocuWare Connection
DocuWare customers are now able to use the powerful features of OQLIS to analyse and visualise their documents and pipeline at at deeper level
All instances of OQLIS with DocuWare connections syncs data automatically
Unlock previously unseen metrics such as bottlenecks in the document pipeline
new connection
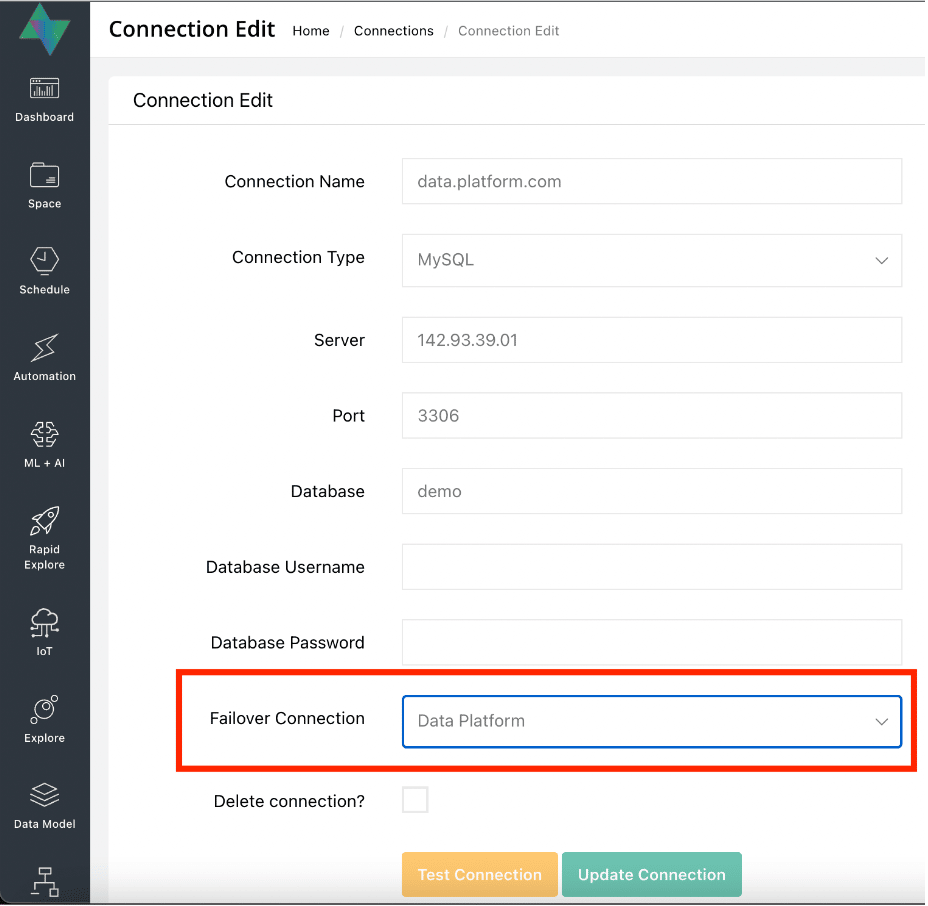
Failover Connection
Allow dashboards to always load data even if the primary data source is offline
OQLIS can provide enterprises high availability of data sources and dashboards in the event of infrastructure failure on a primary database.
If a connection can’t be established to the current database, then this feature will automatically failover to a secondary database
