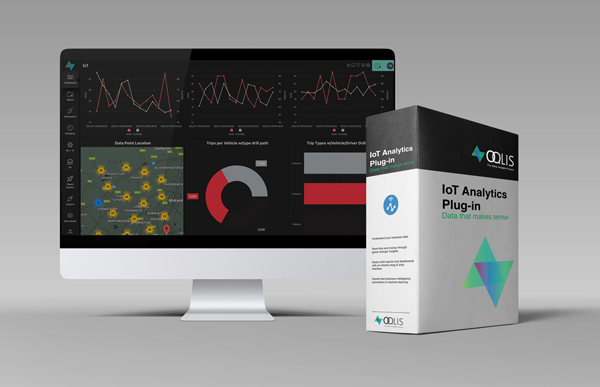
Bold statement? Perhaps. But hear us out. Unless you can put a value to your sensor data, (literally, through a visual display of numbers, graphs, and charts, and subsequently strategically through predictive insights and Machine Learning) it’s just cool tech connecting things. But here is where the value lies: in the WHY.
Why are we connecting these things and how is it beneficial to the company? Does it save money? Does it optimise time? Does it prevent losses? Does it flag wastage? On its own, without data insights and control, IoT is oftentimes merely hype without any tangible results.

Making sense of a mountain of IoT data
In modern business, data is everything. It drives corporate strategy and superior decision-making based on the data’s metrics. Provided it is presented in a way that allows for fast analysis in real-time.
To make their solutions’ implementation easily and meaningfully available to their clients, whilst delivering the desired outcomes in a short timeframe, more and more IoT (Internet of Things) technology solutions innovators globally, partner with specialist data analytics company OQLIS.
The value of having data available in real-time is proving to be a key differentiator. Visually presenting data – and making sense of said data – delivers great value to IoT application customers.
Finding specialist partners to enhance IoT offerings to customers should be a cornerstone of IoT application corporate strategies. It delivers meaning, success, and, acceleration in a vibrant and competitive IoT industry. Without data insights, projects are more likely to fail and waste tons of customers’ valuable time and money.

Where the true value lies
According to Shawn Winterburn, CEO of OQLIS, extracting insight from data is critical:
“Our visual exploration and dashboard interface contextualises data, allowing our AI-driven insight engine to detect trends and opportunities. Our interface literally helps companies digest that data easily, allowing for improved decision-making and fast response times.”
“Without visualisation of data, business managers need to review spreadsheets and other data sources in search of answers. Drilling down into the issues that need urgent attention can be time-consuming. Visualisation, using AI and machine learning, can automate the presentation of the data, making analytics revolutionary, in comparison to the status quo,” Winterburn concludes.
The dashboards are designed in such a way that non-technical people can analyse them and recommend courses of action for their businesses. OQLIS has delivered its data analytics solution for diverse IoT projects across different industries.
Invest in the only Internet of Things Analytics Plug-in your IoT app will ever need today.
Share:
